Fibonacci retracements are a technical analysis tool that uses horizontal lines to indicate areas where a financial instrument’s price may experience support or resistance.
These levels are derived from the Fibonacci sequence and are commonly used in conjunction with trend lines to find entry and exit points in the market. The most commonly used Fibonacci retracement levels are 38.2%, 50%, and 61.8%.
Why Fibonacci Retracements are Important?
Fibonacci retracements are important because they are based on the idea that markets will retrace a predictable portion of a move, after which they will continue to move in the original direction.
This means that traders can use Fibonacci retracements to identify key levels at which a market may experience support or resistance, and then make trades based on that information.
Additionally, traders can use Fibonacci retracements in combination with other technical analysis tools, such as trend lines and moving averages, to create a more comprehensive trading strategy. Overall, Fibonacci retracements provide traders with a way to identify key levels in the market that may indicate potential buying or selling opportunities.
How to Use Fibonacci Retracements
Fibonacci retracements can be used in a few different ways, but the most common method is as follows:
- Identify the significant high and low points of the price move you are analyzing. These points will be used as the anchor points for the Fibonacci retracement levels.
- Draw a trendline connecting the high and low points.
- Use the Fibonacci retracement tool in your charting software to plot the levels of 38.2%, 50%, and 61.8% between the high and low points.
- Watch for price action at these levels. If the price finds support or resistance at one of these levels, it may indicate that the market is reversing or continuing in the direction of the original move.
- Traders may choose to enter the market or exit their positions when the price reaches these levels.
It’s also worth noting that Fibonacci retracements are not a standalone tool and they should be used in conjunction with other technical analysis tools and market fundamentals.
Keep in mind that Fibonacci retracements are not always accurate and market conditions change over time, which may render previous Fibonacci levels no longer effective, so traders should always use caution and keep up to date with the markets.
Types of Fibonacci Levels
There are several types of Fibonacci levels that are commonly used in technical analysis, including:
- Fibonacci retracement levels: These levels indicate areas where a security’s price may experience support or resistance after a significant price movement. The most commonly used retracement levels are 38.2%, 50%, and 61.8%.
- Fibonacci extension levels: These levels indicate potential levels where a security’s price may reach after a significant price movement. The most commonly used extension levels are 100%, 161.8%, and 261.8%.
- Fibonacci Fans: These are lines that are drawn from a high and low point on a chart to indicate areas of support and resistance. The lines are created by taking the vertical distance between the high and low point and dividing it by the Fibonacci ratios to create lines that intersect the price chart at various points.
- Fibonacci Arcs: These are similar to Fibonacci Fans, but instead of lines, they are represented by arcs. An arc is created by drawing an imaginary circle between the high and low points. The arcs are created by taking the vertical distance between the high and low point and dividing it by the Fibonacci ratios to create arcs that intersect the price chart at various points
It’s important to note that Fibonacci levels are not always accurate and should be used in conjunction with other technical analysis tools and indicators.
- How do I start Intraday Trading for beginners?
- What is Intraday Trading: Its Types, Strategy, and more
- Intraday Trading Tips, Strategies & Basic Rules
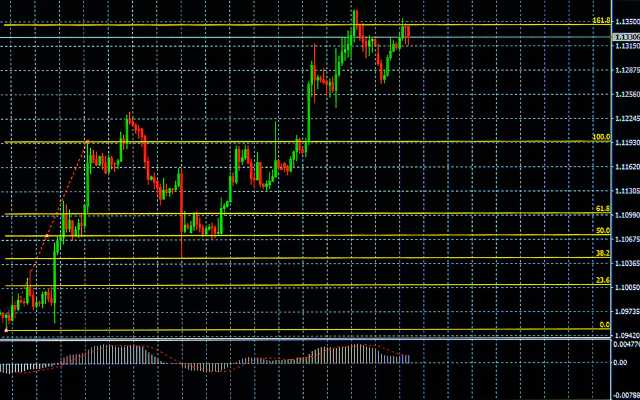
Finding Fibonacci Retracement Levels
You must locate the most recent important Swing Highs and Swing Lows in order to determine these Fibonacci retracement levels.
In order to move the mouse to the most recent Swing Low for downtrends, first click on Swing High.
When a trend is upward, act contrary. Drag the pointer to the most recent Swing High after clicking Swing Low.
Let’s now look at a few instances when Fibonacci retracement levels have been used to analyze currency markets.
- Uptrend
- Downtrend
Uptrend
An uptrend in a Fibonacci level refers to an upward trend in the price of an asset (such as a stock or commodity) that is in line with one of the key levels identified by the Fibonacci ratio.
The Fibonacci ratio, which is based on the Fibonacci sequence, is a widely-used tool in technical analysis to identify levels of support and resistance in the price of an asset. An uptrend in a Fibonacci level suggests that the asset is likely to continue to increase in value.
Downtrend
A downtrend in a Fibonacci level refers to a downward trend in the price of an asset (such as a stock or commodity) that is in line with one of the key levels identified by the Fibonacci ratio.
The Fibonacci ratio, which is based on the Fibonacci sequence, is a widely-used tool in technical analysis to identify levels of support and resistance in the price of an asset. A downtrend in a Fibonacci level suggests that the asset is likely to continue to decrease in value.